


Deficits & Debt & Demographics, Oh My!
Why Building Wealth has Become a Hero's Journey


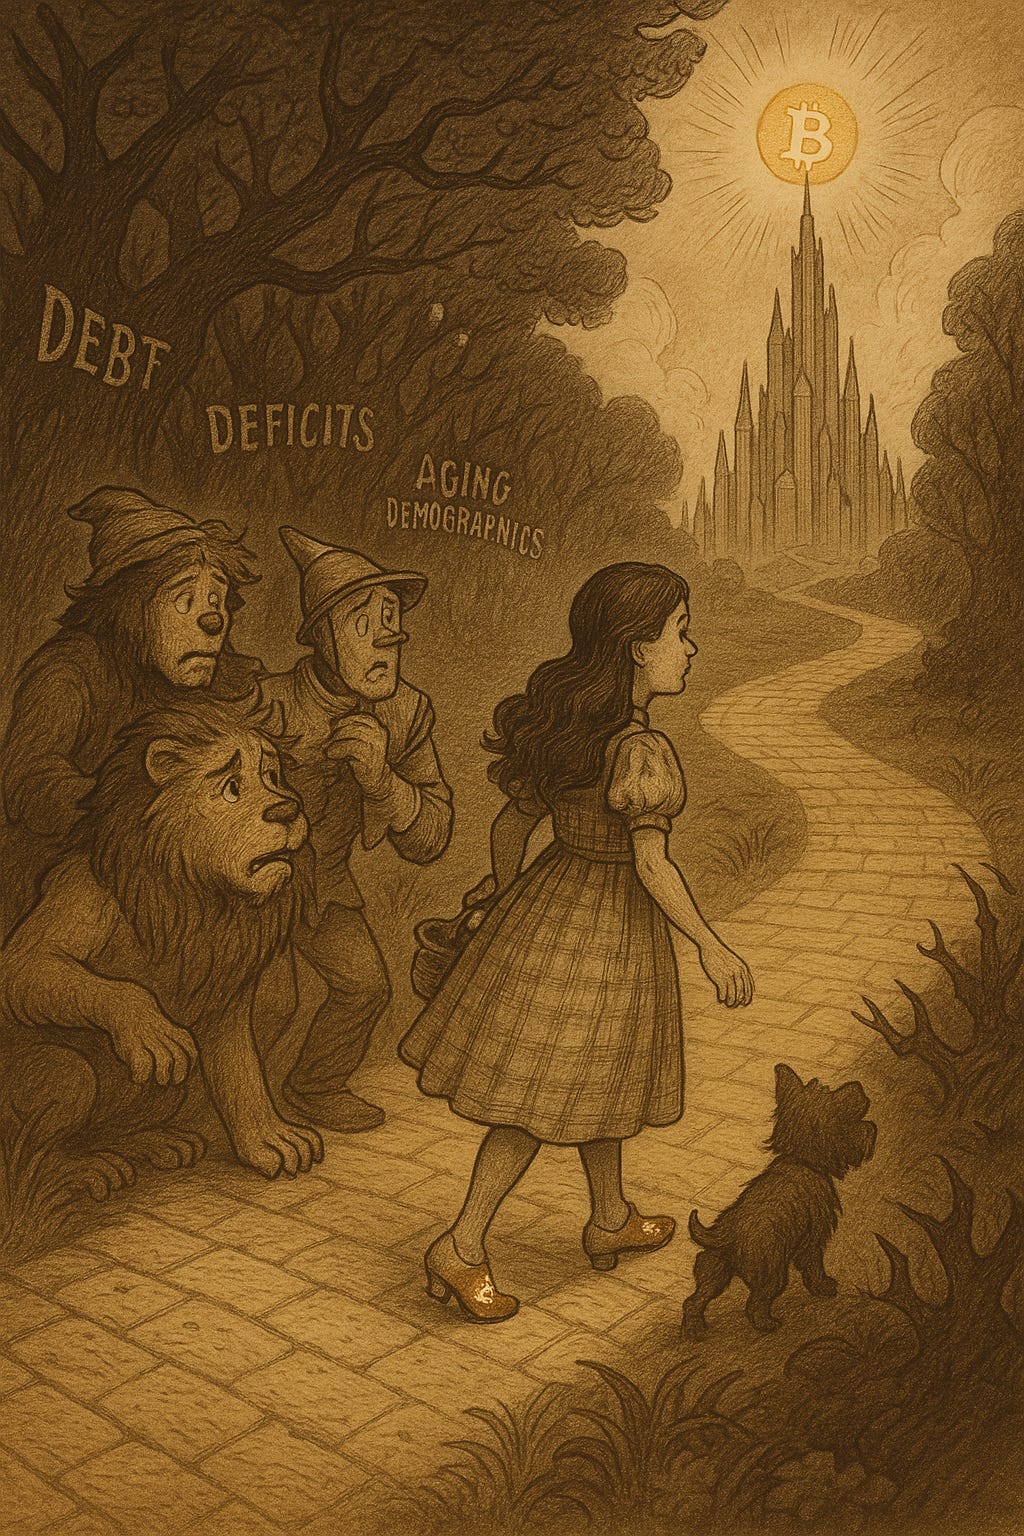
“Toto, I’ve a feeling we’re not in Kansas anymore” - L. Frank Baum, The Wonderful Wizard of Oz. 1900
The Forest of Debt
The persistent gains in gold and bitcoin tell us that investors and foreign central banks are waking up to a sobering reality: U.S. deficits are no longer a cyclical blip—they’re structural.
Interest costs and entitlement spending for an aging population are compounding faster than GDP, and the bill is coming due.
So deep is this forest of debt, and so wide our ‘peacetime’ deficit, that even the once-almighty Fed Put can’t guide us back to the long-lost land of balanced budgets and living-wage prosperity.
It isn’t about the price of money anymore. It’s about the relentless growth in the supply of money and debt, a balloon drifting farther from view than the Wizard’s own getaway.


Just the Facts (Redux)
In our prior post, Just the Facts, we noted Treasury Secretary Bessent’s tacit embrace of a “grow-baby-grow” playbook—one that trades higher inflation for political breathing room. Markets saw this coming: YTD and 1-year charts show Gold and Bitcoin sprinting ahead while bonds limp behind.
Knock-On Effects
Managing a debt load of this size ripples through public and private enterprises alike. This has forced the U.S. to paper over cracks in the system by delaying pension payments and creating new liquidity facilities (BTFP).
In the private arena, fundamental and quant asset managers are left flying blind as companies pull guidance and market data is rendered all but useless as past is not prologue regarding policy, trade and more.
To make the analysis bite-size, we used Gemini AI to record a short audio explainer.
▶️ Listen to the clip below.
The audio clip addresses:
The $10 trillion in Treasury issuance YTD through April—85 % of it in T-Bills, signaling waning appetite for duration.
A deficit that is 26% larger in FY25 than in the same period in '24.
Managing the debt ceiling: Why the U.S. Treasury drew down over $240 billion from their ‘checking account’ at the Fed in May at the Fed, the TGA, with the remaining $436B likely exhausted in the coming months given the debt ceiling constraint. We estimate that the debt impasse will be lifted in late Q3.
If you want a scenario analysis for your models, look to the 2H of 2023 when the debt ceiling was last lifted.

Coming Attractions

We’ll flesh out the Wizard of Oz allegory in an upcoming long-form essay. For now, paid subscribers can preview a one-page Oz Ledger—a character-by-character roadmap linking Baum’s 1900 satire to today’s socio-economic backdrop.
Free readers: grab a complimentary 1-month upgrade here to peek behind the curtain.
Dates for Your Calendar
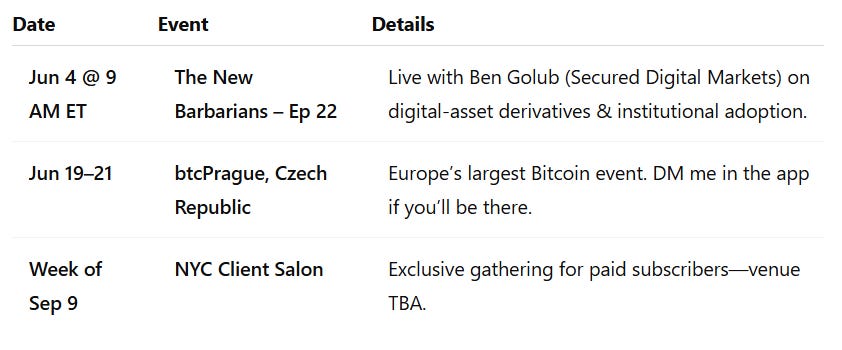
Link to this morning’s New Barbarians Podcast here
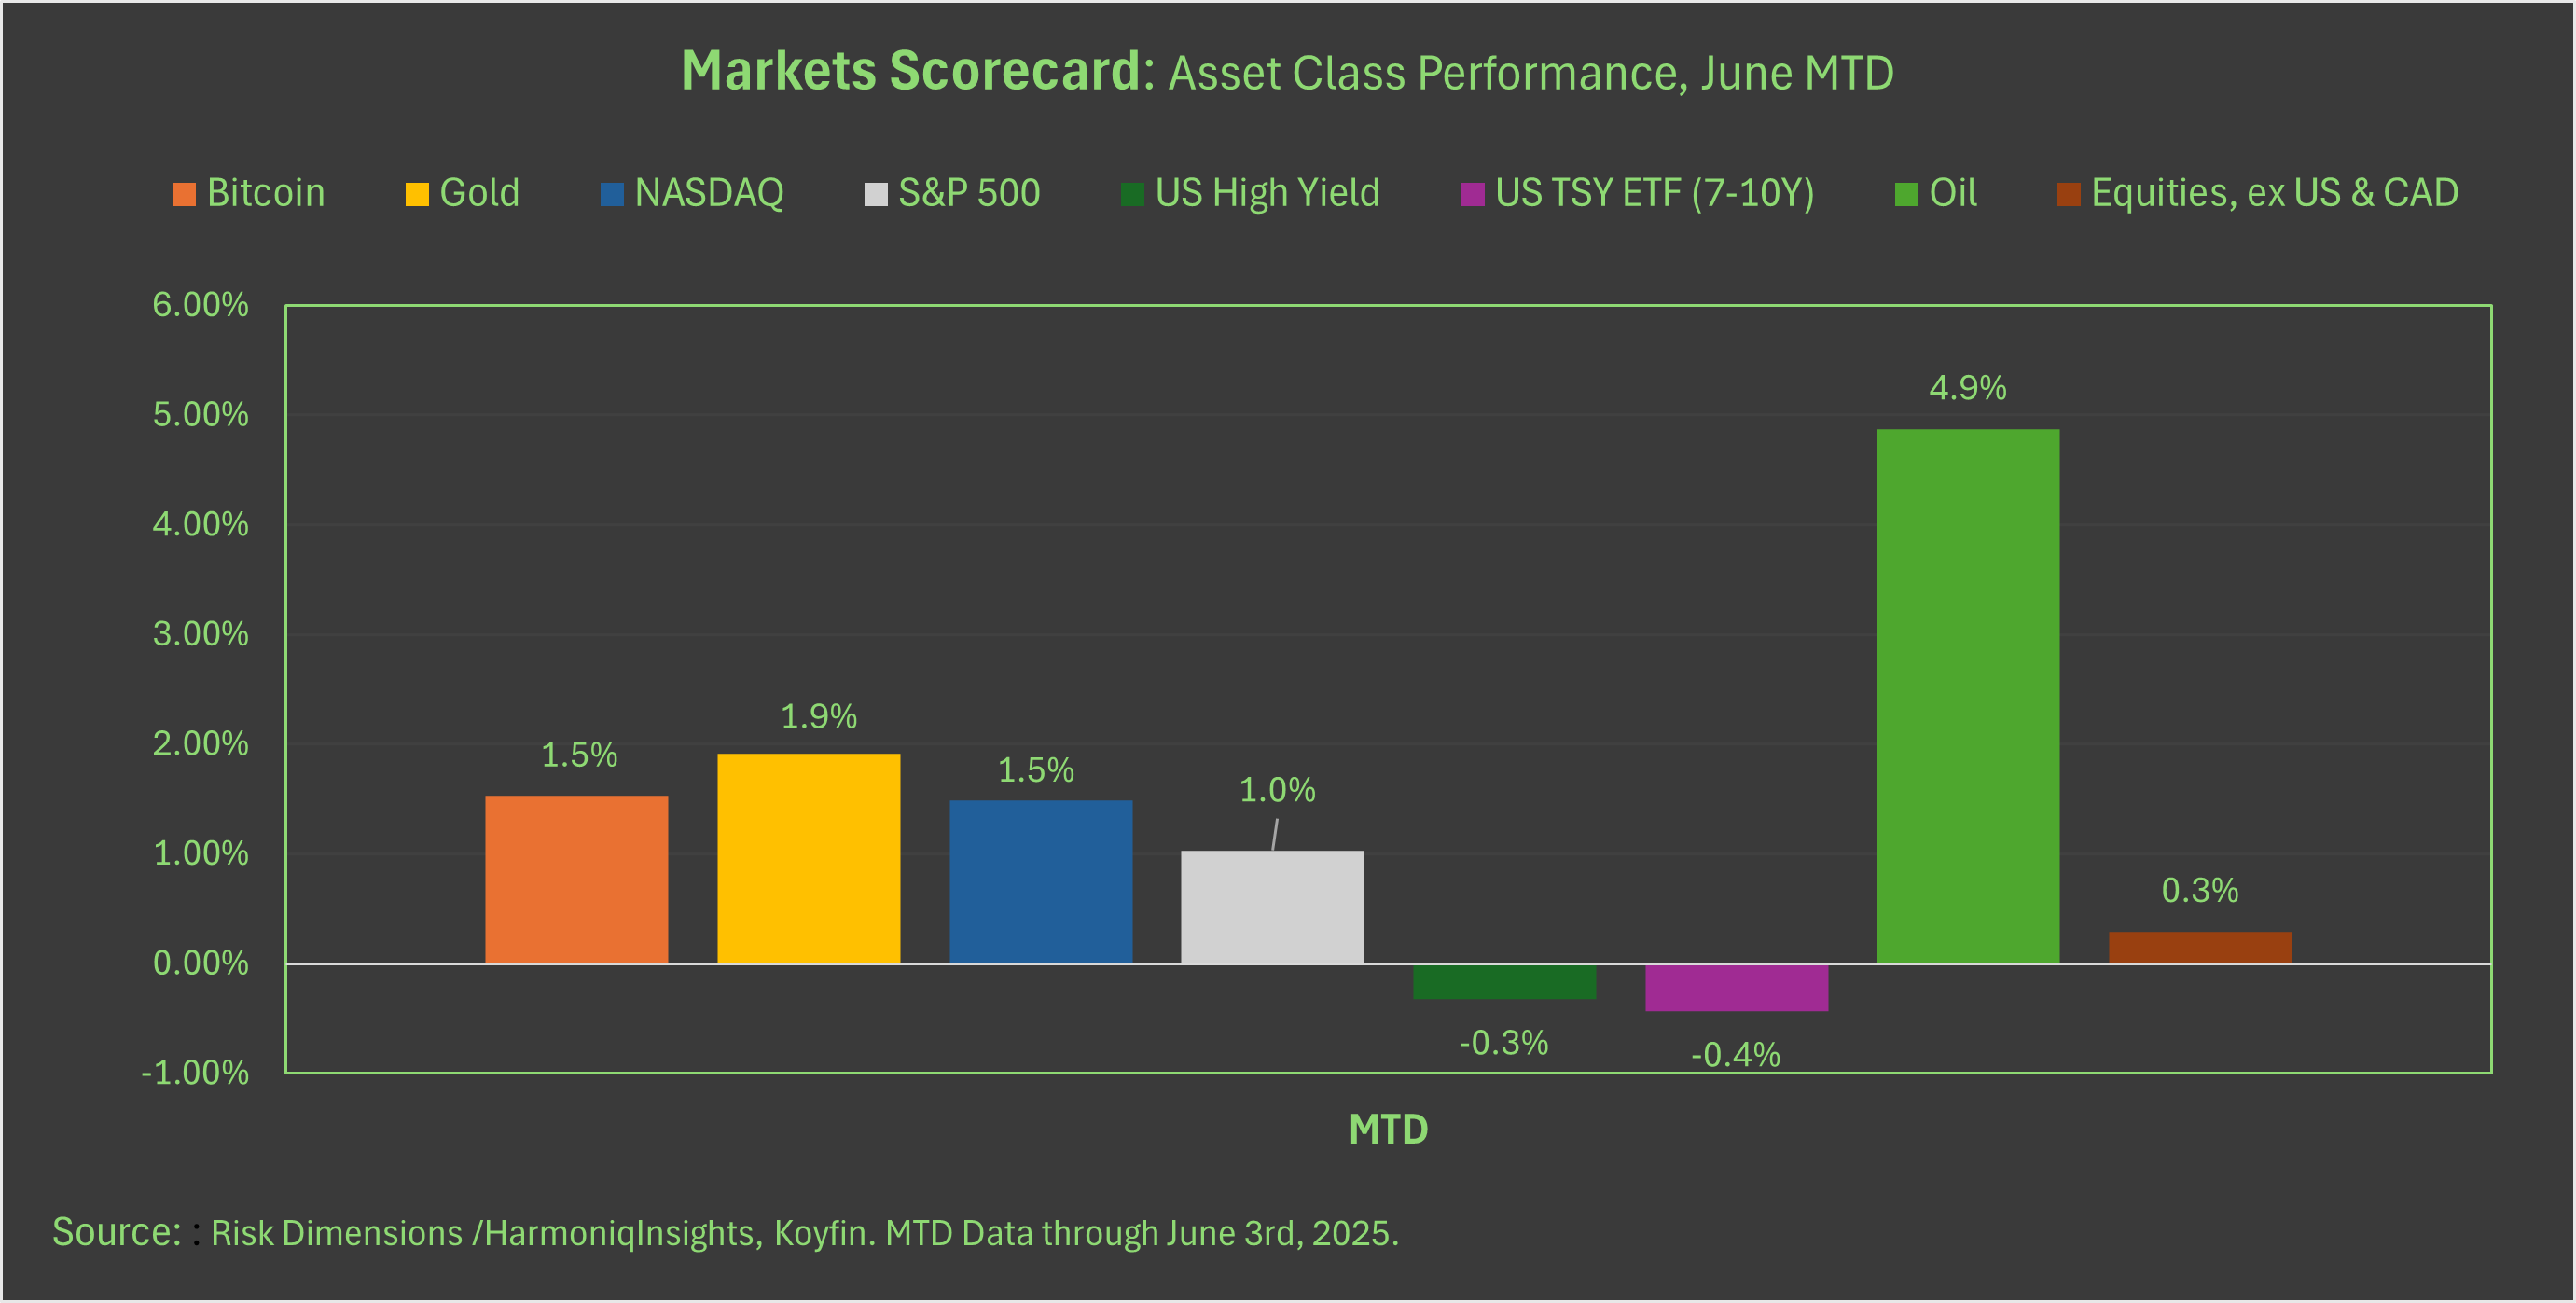
Markets in Three Charts
Everything-but-Bonds Rally in June: Oil pops on supply constraints (OPEC cuts, Canadian wildfires) and a softer USD expected for the near future (DXY ≈ 99.4, −8.5 % YTD). Scarce assets—Gold & BTC—remain investor top picks; *industrial commodities like oil need a different playbook.
*One caveat is silver, which has lagged gold’s multi-year rally, but is uncharacteristically leading gold in June, +4.6% vs. gold’s +2.1% gain. If this pattern continues, it will likely mark an uptick in bullish investor sentiment and possibly spillover into equities and alt coins.
May Wrap-Up:
YTD Winners: Gold, Bitcoin, Developed ex-US equities (led by Germany’s DAX +23 %).
10-Year View: Gold’s CAGR climbs from 10.7 % (10Y) → 13.7 % (5Y) → 40.4 % trailing 1Y—and is annualizing north of 50 % YTD.
Understanding gold’s embrace by central banks and traditional investors is key to grasping why Bitcoin’s trajectory is even steeper, compounding MORE than Gold.
Keep reading with a 7-day free trial
Subscribe to The Macro Case for Bitcoin to keep reading this post and get 7 days of free access to the full post archives.